Who called me? - How To Get The Caller Of a Function In Python?

If you’re trying to debug or understand a piece of Python code, sometimes it is not enough to just run it “in your head”. Luckily there are some great tools that can help you out.
The best way to get the caller of a Python function in a program is to use a debugger. As an alternative, if you want to get this info programmatically, you can analyze the call stack trace with the inspect package.
I’ll show you both methods, and also present a third alternative - using an execution visualizer.
Get The Caller Using a Debugger
The advantage of using a debugger, is that you don’t have to modify the actual program code.
It cannot be used in your program - for that you need to use inspect, so if you want to make decisions in your code based on the caller, than feel free to skip ahead to the next section.
What Is A Debugger?
A debugger is a software tool, that is used to examine programs, it is mainly used to investigate bugs or performance problems. A debugger allows you to pause, restart or even execute your program step-by-step. You can also interactively examine or modify the variables in your program while it is running.
Getting used to a debugger takes a bit of practice, but it is a very valuable skill, every aspiring software developer should take the time to get familiar with using one.
What Is PDB?
If you have Python installed on your machine, you already have a debugger, as Python by default ships with the pdb module - The Python Debugger.
I’ll show you how you can use pdb with the help of a simple example. I’m going to use this little script for demonstration:
def called_function():
    print("I am called")

def caller_function():
    print("I am the caller")
    called_function()

caller_function()
Our goal is to stop the running program when called_function is executed and find out from where is it being called.
Start PDB
First, we need to start the script with pdb:
python3 -m pdb whocalled.pyThis will load the script, but pause its execution before the first line. Pdb will print the line that we’re standing on, and then give us an interactive (Pdb) prompt.
> /pythonin1minute/whocalled.py(1)<module>()
-> def called_function():
(Pdb)
Set a Breakpoint - Tell PDB to Pause at a Certain Point
To make pdb pause at called_function we’ll need to set a so-called breakpoint. When the execution reaches a breakpoint the debugger pauses the program and gives us back to interactive prompt, so we’ll be able to inspect the state of the program.
A breakpoint can be created with the command breakpoint. As its first argument, we can specify a filename and a line number, or function name. We’ll use the function name called_function:
(Pdb) break called_functionContinue - Resume Execution Until We Reach the Breakpoint
We can let the script run with the continue command. It will stop at the next breakpoint or when the program finishes execution.
(Pdb) continueMake PDB Print the Call Stack Trace
Pdb will stop at the breakpoint that we’ve placed at called_function:
I am the caller
> /pythonin1minute/whocalled.py(2)called_function()
-> print("I am called")
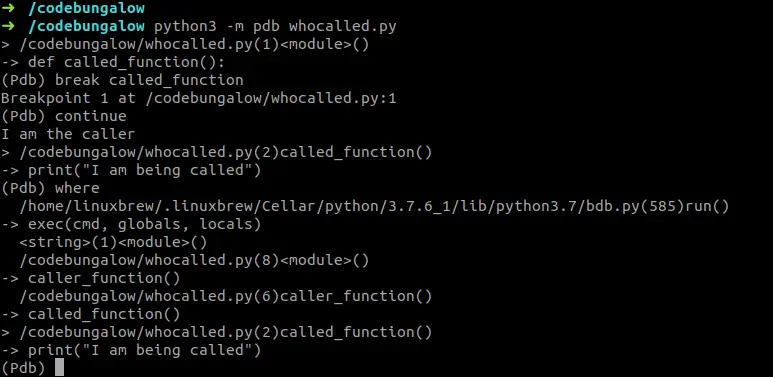
Now, we can use the where command to print the call stack trace.
(Pdb) where
  /home/linuxbrew/.linuxbrew/Cellar/python/3.7.6_1/lib/python3.7/bdb.py(585)run()
-> exec(cmd, globals, locals)
  <string>(1)<module>()
  /pythonin1minute/whocalled.py(8)<module>()
-> caller_function()
  /pythonin1minute/whocalled.py(6)caller_function()
-> called_function()
> /pythonin1minute/whocalled.py(2)called_function()
-> print("I am called")
As you can see the stack trace is basically a list of the call chain, with the latest call at the bottom. You can read it backwards - from the bottom up:
printis being called bycalled_functioncalled_functionis being called bycaller_functioncaller_functionis being called byexec
This whole pdb session to inspect the function call chain looks something like this:

Visual Interfaces for Debuggers
Pdb is very powerful on its own, but the command-line interface is not the most intuitive or flexible one. Luckily most modern IDEs - like PyCharm or Visual Studio Code - provide a more friendly visual interface for debugging.
Code Visualizers
Another nice way to examine the execution of your code is to use a code visualizer. It’s exactly the same mechanism as using a debugger, but you get a nice visualization of how your program is executed.
If you’re trying to understand a smaller snippet, you can use the online visualizer at pythontutor.com. It’s great for educational purposes.
Running through the previous example, I got a nice little execution graph:

Get The Caller Using inspect
The inspect module provides developers tools to examine the current program state, you can get a lot of useful runtime information about your objects and variables.
If you want to make decisions based on the caller of the function this is the way to go.
Note: most of the time this is not a good idea and - unless you really know what you’re doing - you should probably revise your program’s architecture. There are few special cases, but generally, functions should communicate with their callers only via regular means e.g.: their arguments and return values.
Getting the Stack During Runtime
The inspect module defines a utility function called stack which we can use to retrieve the call stack.
Calling stack() returns a list, where the first element is the last call (the function that we call stack() from), the second element is the function that called us, and so on.
Each element returns a namedtuple, that has a function property, which returns the function name. It means we can get the caller like this:
from inspect import stack

stack()[1].function
So, getting back to our previous example, we can do something like:
from inspect import stack
def called_function():
    print("CALLER FUNCTION: {}".format(stack()[1].function))
    print("I am being called")

def caller_function():
    print("I am the caller")
    called_function()

caller_function()
The output will be:
I am the caller
CALLER FUNCTION: caller_function
I am being called